How to Read a Stock Chart: A Beginner's Guide
Candlesticks, volume bars, and moving-average lines don't have to be intimidating — here's what each part of a stock chart is actually telling you.

Start with the simplest version: a line chart
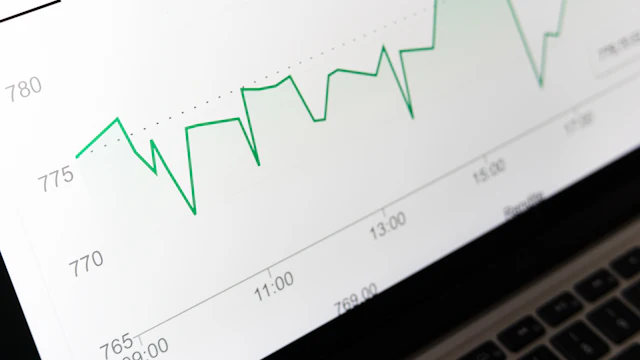
The easiest chart to read is a line chart, which simply connects the closing price of a stock at the end of each day (or week, or minute) into a single continuous line. It answers one question clearly: has this stock generally gone up or down over the period shown? Most financial news sites default to a line chart for exactly this reason — it's fast to read and hard to misinterpret.
The tradeoff is that a line chart throws away everything that happened during each trading session. It shows you where a stock ended the day, but not whether it was a calm session or a wild one. That's where candlestick charts come in.
Decoding a candlestick
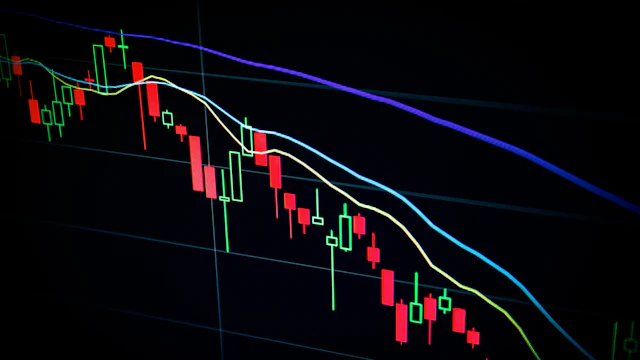
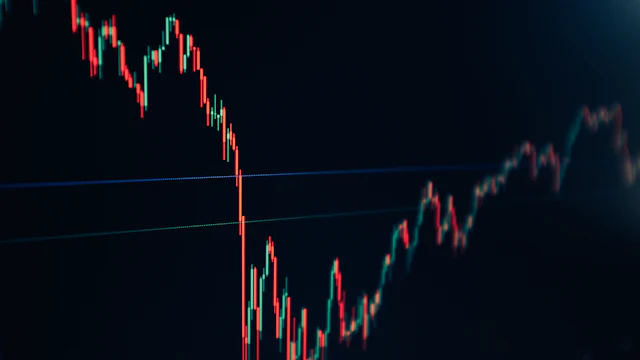
A candlestick packs four prices into one shape: the open (price at the start of the period), the close (price at the end), the high, and the low. The thick part of the candle — the "body" — stretches between the open and close. The thin lines above and below — the "wicks" or "shadows" — mark the high and low reached during that period.
- A filled or downward-colored body usually means the close was lower than the open — the stock lost ground during that period.
- A hollow or upward-colored body usually means the close was higher than the open — the stock gained ground.
- Long wicks show the price swung far in one direction before pulling back, which can signal indecision between buyers and sellers.
Each candlestick represents whatever time period the chart is set to — one minute, one day, one week. A daily chart spanning six months will show roughly 130 individual candles, one per trading day, letting you see both the big trend and the day-to-day volatility that produced it.
Volume: the chart's supporting evidence
Beneath most price charts sits a row of vertical bars representing volume — the number of shares that changed hands in that period. Volume matters because it tells you how many market participants agreed on a price move. A stock that jumps 5% on triple its average volume suggests broad conviction behind the move. The same 5% jump on unusually light volume is easier to dismiss as noise, or the action of just a few traders.
Price tells you what happened. Volume tells you how many people showed up to make it happen.
Moving averages: smoothing out the noise
Many charts overlay one or more moving-average lines, which plot the average closing price over a set number of periods — 50 days and 200 days are common choices. Because a moving average smooths out day-to-day zigzags, it makes the underlying trend easier to see at a glance. When the price sits above a rising moving average, the trend is generally considered healthy; when it slips below a falling one, that's often read as a warning sign. (Our guide to SMA vs. EMA goes deeper on how these lines are calculated.)
What a chart can't tell you
It's worth being honest about the limits here. A chart is a complete record of the past, not a forecast of the future. Patterns that look obvious in hindsight are far less obvious in real time, and two chart readers can look at the identical candlestick pattern and draw opposite conclusions. Charts are best treated as one input for understanding a stock's recent behavior and trading context — not a crystal ball for where the price goes next.
This article is educational and general in nature. It isn’t personalized investment, tax, or legal advice — always weigh your own circumstances, or talk to a licensed professional, before making financial decisions.
Keep reading
Related guides on this topic.
 Stock Market Basics
What Is the Stock Market and How Does It Actually Work?
A plain-English walkthrough of what a stock exchange actually does, how shares get priced, and why the market moves the way it does.
 Stock Market Basics
Market Orders vs. Limit Orders: Which Should You Use?
The order type you choose determines whether you're guaranteed a trade or guaranteed a price — you can't always have both. Here's how to pick.
 Stock Market Basics
How Does Compound Interest Work With Stocks? Dividends, Reinvesting and Real Examples
Stocks do not pay interest, but they compound in a similar way: through rising earnings and reinvested dividends. How compounding with stocks really works, a worked example, why dividends matter so much, and the three things that break it.
 Stock Market Basics
How to Buy an ETF in Europe, Step by Step (2026)
Buying your first ETF takes less than an hour. How to choose a broker, find the right fund, read its fact sheet, place the order and set up regular investing — and the mistakes beginners most often make.
 Stock Market Basics
Bull Markets vs. Bear Markets: What Every Investor Should Know
Bull and bear markets aren't just moods — they're specific, measurable moves. Here's the actual definition, and what tends to separate the two.
 Trading & Technical Analysis
What Is Technical Analysis? A Beginner's Introduction
Technical analysis studies price and volume patterns instead of company fundamentals. Here's the core logic behind it, and its real limitations.